Need some advice?
Leave your details and we will get in touch.
I want to be contacted by an expert1 /

As we near the end of 2019, Sheridan Elliott - SOCOTEC Monitoring’s technical manager - provides an overview of how instrumentation and data management systems have evolved over time, as well as touching on a few predictions for the future.

From measuring flow using a bucket to capturing data in the cloud, as geotechnical and structural monitoring projects have become more complex, instrumentation and data management software has become more sophisticated to meet changing client requirements.
Sheridan Elliott - SOCOTEC Monitoring’s technical manager - provides an overview of how instrumentation and data management systems have evolved over time, as well as touching on a few predictions for the future.
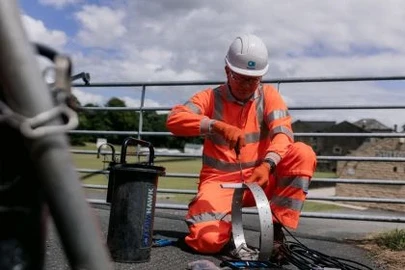
In the past, sensors were very primitive. Readouts were all handheld and site technicians were required to travel across the country to take measurements manually, which was incredibly labour intensive. To measure flow, for example, a site technician’s specialist equipment would include a bucket. Having a known volume, the technician would record how long it took to fill that bucket, manually writing the measurements down.
Inclinometers, which are used to measure deformation of an embankment, whilst a little more sophisticated than a flow jug, still required a lot of hardware and all measurements still had to be handwritten.
In earlier years, monitoring data was collected using a readout unit, with site technicians travelling to site to plug an inclinometer in, for example, writing down each data point at half meter intervals. Some of these inclinometers could be over 50m deep, so it would involve recording a large number of data points. The site technician would then be required to travel back to the office to plot these data points manually on graph paper.
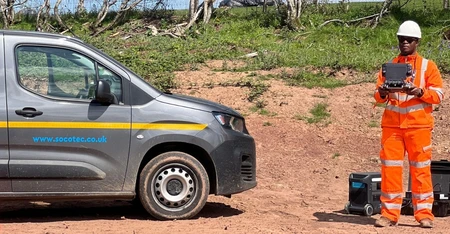
Over the past 10 years, the industry has moved to using silicon-based products and MEMS (Micro Electrical Mechanical Systems), as well as wireless sensors. Whilst the instrument is still required to be installed on site, by inserting the probe into a bore hole, all data readings are transmitted cable-free via Bluetooth communication to a rugged field tablet and stored in the cloud. When the technician returns to the office, reports are automatically generated and emailed out to the client.
Early data visualisation packages were DOS based, moving on to a Windows platform a year or so later. The PC had to be in the same location as the data, so if there were any issues and the site technician or client wanted to view the data, a site visit was required. Now, data is all cloud based, so clients can log in at any time, on any connected device, from anywhere in the world.
SOCOTEC Monitoring developed Calyx OMS™ (online monitoring software) to provide a user-friendly graphical interface, which allows quick and easy interpretation of large amounts of instrumentation data from multiple sources. This web-based software package can be fully configured to suit specific user and job requirements and can be deployed on virtually any project, regardless of scale.
With Calyx OMS™, the type of monitoring data recorded and the way it is delivered is highly flexible. Accessible 24/7, it provides continual monitoring of site conditions, offering status updates and reassurance to clients wherever they choose to view the data. Sensor-specific thresholds can be defined which enable Calyx OMS™ to issue SMS and email action alerts to those who need them.
Data provided through Calyx OMS™ is vital to decision making throughout a monitoring campaign, so ensuring that this data is presented clearly and is constantly accessible is paramount to successful site projects. As Calyx OMS™ is browser based, it can be accessible from any location with an internet connection and the simple and clear project specific dashboard provides a summary of site conditions at a glance. Data may also be made available for use with other applications, such as asset management platforms.
Instrumentation and data management software has come a long way, but it is constantly evolving to meet the ever-changing requirements of clients and their projects. Even in the next five years, SOCOTEC Monitoring expects the industry to adopt some, if not all, of the following equipment and techniques.
If you have a geotechnical or structural monitoring requirement to discuss, please contact the SOCOTEC Monitoring team. We’re always happy to share our expertise.
Do you require support with geotechnical and structural monitoring?